- 31 Airport Road, by Old Airport, Delta, Nigeria
- [email protected]
Understanding the Decision Tree Algorithm A Powerful Tool for Decision-Making

Understanding the Decision Tree Algorithm A Powerful Tool for Decision-Making
Description:
In the rapidly evolving field of machine learning, the Decision Tree Algorithm stands out for its simplicity, interpretability, and ability to tackle both classification and regression tasks. This algorithm is a favorite among data scientists and analysts for its intuitive approach to decision-making and its capacity to handle complex datasets.
This guide provides a comprehensive overview of decision trees, breaking down their mechanics, key components, and practical applications. Whether you're a beginner looking to understand the basics or a professional seeking to optimize your models, this article offers actionable insights and tips to harness the power of decision trees effectively.
Introduction
In the world of machine learning, the Decision Tree Algorithm is a versatile and intuitive method for solving classification and regression problems. Its simplicity, interpretability, and ability to handle complex datasets make it a go-to choice for data scientists and analysts. This article explores how decision trees work, their key components, and why they’re invaluable in real-world applications.
1. What is a Decision Tree?
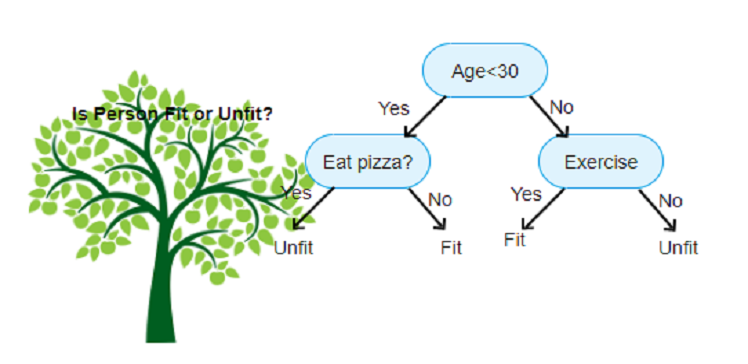
A decision tree is a flowchart-like representation of decisions and their possible consequences, including chance event outcomes, costs, and utility. In machine learning, it’s a predictive model that maps observations about an item (features) to conclusions about the item’s target value (labels or numerical values).
Think of it like a game of 20 questions: you ask a series of yes-or-no questions to narrow down possibilities until you reach a conclusion. Similarly, a decision tree splits data into branches based on feature values, leading to a final decision or prediction.
2. How Does the Decision Tree Algorithm Work?
The algorithm constructs a tree by recursively splitting the input space into regions based on feature values. Here’s a step-by-step breakdown:
Root Node: The starting point, representing the entire dataset. Splitting: The algorithm selects the best feature to split the data based on a criterion (e.g., Gini Impurity, Information Gain, or Variance Reduction). This creates child nodes. Internal Nodes: These represent decision points where further splits occur based on other features. Leaf Nodes: The terminal nodes, which provide the final output (class label for classification or numerical value for regression). Pruning: To avoid overfitting, the tree may be trimmed by removing branches that add little predictive power.
Key Process:
The algorithm chooses the “best” split by evaluating which feature and threshold maximize the separation of classes (for classification) or minimize error (for regression).
3. Key Components of Decision Trees
Entropy and Information Gain: Entropy measures the impurity or randomness in a dataset. Information Gain quantifies the reduction in entropy after a split, helping the algorithm choose the most informative features. Gini Impurity: An alternative to entropy, Gini measures the probability of misclassifying a randomly chosen element. Lower Gini values indicate better splits. Pruning: Techniques like pre-pruning (stopping tree growth early) and post-pruning (removing branches after building) prevent overfitting. Feature Importance: Decision trees rank features based on how much they contribute to reducing impurity, offering insights into which variables drive predictions.
4. Advantages of Decision Trees
Interpretability: The tree structure is easy to understand and visualize, making it ideal for explaining models to non-technical stakeholders. Handles Non-Linear Data: Decision trees can capture complex relationships without requiring data to be linearly separable. Minimal Preprocessing: They work well with both categorical and numerical data and are robust to missing values and outliers.
5. Limitations to Consider
Overfitting: Without pruning, decision trees can become overly complex, fitting noise in the training data. Instability: Small changes in the data can lead to entirely different trees, making them sensitive to noise. Bias Toward Dominant Classes: In imbalanced datasets, decision trees may favor majority classes.
Solutions:
Use techniques like Random Forests (ensembles of decision trees) or Gradient Boosting to improve robustness and accuracy.
6. Real-World Applications
Decision trees are widely used across industries:
Finance: Credit scoring and fraud detection by classifying applicants or transactions. Healthcare: Diagnosing diseases based on patient symptoms and medical history. Marketing: Customer segmentation and churn prediction by analyzing behavior patterns. Manufacturing: Predictive maintenance by identifying equipment failure risks.
7. Tips for Using Decision Trees Effectively
Tune Hyperparameters: Adjust max depth, minimum samples per split, and pruning criteria to balance bias and variance.
Use Ensemble Methods: Combine decision trees with bagging (Random Forests) or boosting (XGBoost, LightGBM) for better performance.
Visualize the Tree: Tools like scikit-learn’s plot_tree or Graphviz help interpret and communicate the model’s logic.
Handle Imbalanced Data: Use techniques like SMOTE or class weighting to address skewed datasets.
Conclusion
The decision tree algorithm is a powerful yet straightforward tool that bridges the gap between data and decision-making. Its ability to break down complex problems into simple, interpretable decisions makes it invaluable for both beginners and seasoned professionals. By understanding its mechanics and limitations, you can leverage decision trees to unlock insights and drive impact in your projects.
Have you used decision trees in your work? Share your experiences or questions in the comments—I’d love to hear your thoughts!
#MachineLearning #DataScience #DecisionTrees #AI


